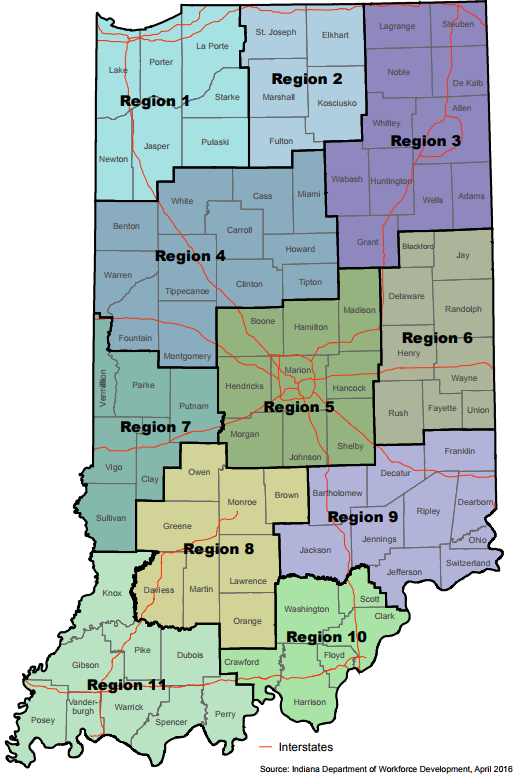
Eighty percent of all nonprofit employment in Indiana is found in 14 metropolitan regions, though the nonprofit sector’s share of total employment varies across metropolitan areas and industries. These Metropolitan Statistical Areas (MSAs) are defined by the US Office of Management and Budget and include 39 of Indiana’s 92 counties.
In this report we make comparisons across Metropolitan Statistical Areas. Each MSA is composed of an urban core area containing a substantial population nucleus with adjacent communities with a high degree of economic and social integration with the core.
Read the Metropolitan Statistical Area excerpt of our 2007 Employment Report here.
Additionally, a special report was prepared in 2015 for our advisory board analyzing employment trends in the Fort Wayne MSA.
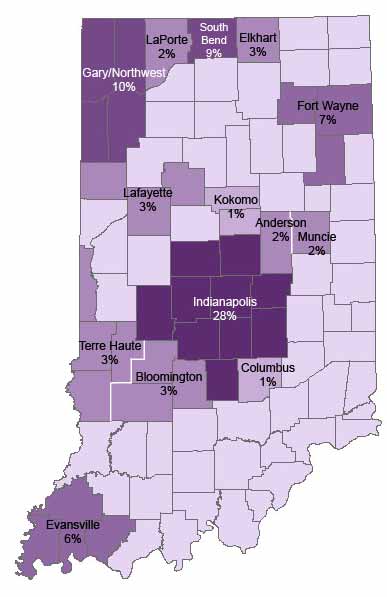
Distribution of Indiana’s nonprofit sector by Metropolitan Statistical Area, 2005